
Industrial IoT for ESG Reporting and Carbon Accounting with OliveIoT
ESG reports are only as reliable as the data behind them. For many manufacturers, facility operators, energy-management teams and climate-tech platforms, that data still comes from manual meter readings, spreadsheets, emailed utility bills and site-level estimates.
That approach may work when reporting is occasional and simple. It becomes harder when a business needs accurate, timestamped and traceable data across factories, warehouses, commercial buildings, utilities and remote assets. Carbon accounting and sustainability reporting need data that reflects what is happening on the ground, not only what someone entered into Excel at the end of the month.
Industrial IoT helps close that gap.
By connecting energy meters, water meters, gas meters, diesel generators, solar systems, PLCs, HVAC systems and industrial equipment to the cloud, Industrial IoT creates a direct link between physical operations and digital ESG systems. This is where OliveIoT Innovations Private Limited fits in. OliveIoT acts as the physical-to-digital data layer that helps ESG software providers, climate-tech companies and industrial businesses collect reliable real-world data from existing assets and send it securely to ESG or carbon accounting platforms.

ESG and carbon platforms need real operational data
ESG and carbon accounting platforms are powerful when they have dependable input data. They can support emissions calculations, water reporting, energy benchmarking, site comparisons, audit trails and internal sustainability reviews. But the platform itself usually does not measure electricity, fuel, gas, water or production activity at the equipment level.
That data has to come from the physical world.
Common data sources include:
Electricity meters for grid power consumption
Sub-meters for production lines, HVAC, compressors and utilities
Water meters for process water, domestic use and recycling systems
Gas meters for boilers, furnaces and process heat
Diesel generators for backup power and fuel use
Fuel tanks and flow meters for diesel, oil or other fuels
Solar inverters and meters for on-site renewable generation
PLCs that hold production, runtime and process data
HVAC systems that report operating hours, load and set points
Industrial equipment such as chillers, compressors, pumps, motors and ovens
Environmental sensors for temperature, humidity, pressure, air quality or emissions-related monitoring
When this information is collected manually, reporting teams often face several problems. Readings may be missed. Meter photos may be unclear. Time periods may not match. Different sites may use different spreadsheet formats. A figure may be copied from one file to another without a clear record of where it came from.
For ESG reporting and carbon accounting, this creates risk. Even small data gaps can affect Scope 1 and Scope 2 calculations, sustainability performance tracking and year-on-year comparisons.
Industrial IoT helps by collecting data directly from the source and moving it into digital systems with timestamps, device identity and status information. This supports ESG data collection that is faster, more consistent and easier to check.
How Industrial IoT moves data from the factory floor to ESG software
Industrial sites already generate large amounts of data. The challenge is not always adding new sensors. In many cases, the data already exists in meters, PLCs, controllers and equipment. The real challenge is connecting those assets to cloud platforms in a reliable and structured way.
A typical data flow looks like this:
`Sensors / Meters / PLCs → RS485 / Modbus / BACnet / 4-20mA → Industrial IoT Gateway → 4G / Ethernet / Wi-Fi → MQTT / HTTPS / API → Cloud → ESG or Carbon Accounting Platform`
Each layer has a clear role.
Sensors, meters and PLCs collect physical measurements
This is where operational data begins. A power meter measures kWh, voltage, current and power factor. A water meter records flow and total consumption. A diesel generator controller reports runtime, fuel level, load and alarms. A PLC may hold production counts, process status and machine operating hours.
These readings represent the reality of the site. They are the raw measurements that can support carbon accounting, energy management and sustainability reporting.
Industrial protocols carry data from assets
Industrial assets often communicate through established protocols and signal types. These include RS485, Modbus, BACnet and 4-20mA signals.
For example:
A power meter may share data over Modbus RTU on RS485
A building HVAC system may use BACnet
A flow sensor may provide a 4-20mA signal
A PLC may share machine data through Modbus TCP or other common protocols
The purpose is simple. These channels allow real equipment to share measured values with another system.
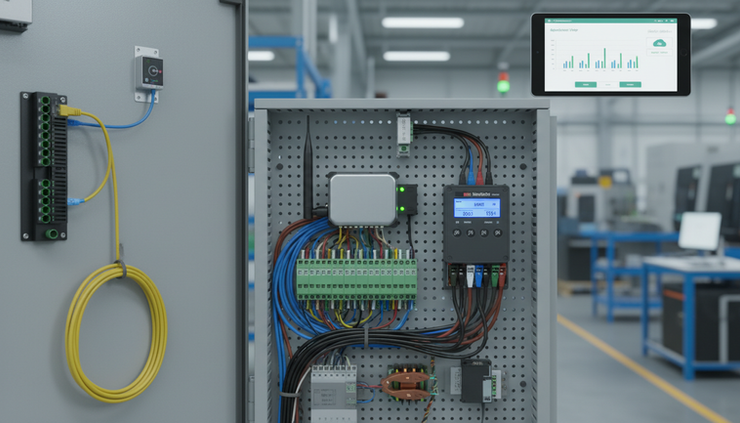
The Industrial IoT Gateway connects site data to the cloud
The Industrial IoT Gateway sits between field devices and cloud platforms. It reads data from connected meters, PLCs and sensors, prepares it in a usable format, and sends it to the required destination.
This is a key part of Industrial IoT for ESG because the gateway can work with real industrial conditions. Sites may have different equipment brands, mixed protocols, old meters, new sensors and uneven connectivity. A well-designed gateway helps bring this data together without replacing every existing system.
Connectivity sends data beyond the site
Once the gateway has collected the data, it can send it through 4G, Ethernet or Wi-Fi, depending on what is available at the location.
This is especially useful for:
Multi-site factory groups
Warehouses and logistics sites
Commercial buildings
Remote utilities
Solar installations
Water and wastewater assets
Sites without reliable wired internet
For locations with unstable network access, offline buffering matters. The gateway can store data locally when the connection drops and send it once connectivity returns. This helps reduce gaps in records and supports more complete reporting.
MQTT, HTTPS and APIs move data into ESG systems
Cloud platforms need data in a format they can receive and process. OliveIoT can send data through MQTT, HTTPS and REST APIs, based on the needs of the ESG platform, carbon accounting platform or energy-management system.
This allows climate-tech and ESG software providers to focus on reporting, analytics, dashboards, emissions calculations and customer workflows, while OliveIoT manages the industrial data acquisition layer.
What data can IoT collect for ESG and carbon accounting
Sustainability data collection often covers several resource streams. Some relate directly to carbon emissions. Others are needed for water stewardship, energy efficiency, environmental reporting or internal performance tracking.
Electricity data for Scope 2 monitoring
Scope 2 emissions usually relate to purchased electricity, heat, steam or cooling. For many companies, electricity is one of the largest and most visible parts of carbon reporting.
Industrial IoT can collect:
Total grid electricity consumption
Site-level kWh readings
Sub-metered energy use by department, line or utility
Demand and peak load
Power quality values
Operating patterns for major loads such as HVAC, compressors and chillers
This supports Scope 2 monitoring by giving teams better visibility into where electricity is used, when peaks occur and how sites compare.
For ESG software providers, direct electricity data feeds reduce the need for customers to upload bills or enter readings manually. Bills may still be used for reconciliation, but IoT data gives a more frequent view of consumption.
Fuel, gas and generator data for Scope 1 monitoring
Scope 1 emissions come from sources owned or controlled by the organisation. In industrial and facility settings, this often includes fuels burned on site.
Industrial IoT can help collect data from:
Diesel generators
Boilers
Gas-fired furnaces
Process heaters
Fuel tanks
Gas meters
Flow meters
Burner control systems
Useful values include fuel consumption, gas flow, generator runtime, load, start-stop records and operating hours. This can support Scope 1 monitoring workflows by giving teams a more direct record of fuel use.
The point is not to replace accounting rules or emissions factors. The point is to provide measured activity data that ESG and carbon systems can use in their calculations.
Solar data for renewable energy tracking
Many sites now operate rooftop solar or other on-site renewable systems. Solar data is useful for sustainability reporting, energy-cost analysis and Scope 2 reduction planning.
Industrial IoT can collect:
Solar generation in kWh
Inverter status
Export and import data
Performance trends
Downtime alerts
Site-level comparison between grid usage and solar generation
This helps sustainability and energy teams understand whether renewable assets are performing as expected.
Water and wastewater data for sustainability reporting
Water may not always be part of carbon accounting, but it is a major ESG data point for many manufacturers, food processors, textile units, property portfolios and industrial sites.
IoT can collect:
Total water consumption
Process water use
Borewell or utility water readings
Recycled water volume
Wastewater discharge flow
Pump runtime
Tank levels
Pressure and leakage indicators
Automated water data helps teams detect unusual consumption, compare sites and improve reporting accuracy.
Environmental and equipment data for wider ESG workflows
Environmental data can also support sustainability and compliance-related reporting. Depending on the site, this may include temperature, humidity, pressure, air quality, tank level, machine runtime, equipment state or alarm records.
Equipment data adds important context. For example, energy use during production hours means something different from energy use during idle time. A chiller that runs continuously may point to maintenance or control issues. A compressor with high night-time consumption may reveal air leakage.
When ESG systems receive both resource data and operating context, sustainability teams can move from basic reporting to better operational understanding.
Why manual Excel-based collection creates reporting friction
Spreadsheets are familiar and flexible. They are still useful for review, analysis and finance workflows. But for recurring ESG data collection across multiple sites, manual spreadsheet processes can become a bottleneck.
Common issues include:
Different sites using different file formats
Manual typing errors
Missing meter readings
Late submissions from facility teams
Unclear reading dates
No direct link to the original meter
Data copied across multiple files
Limited visibility into equipment-level consumption
Hard-to-audit changes
A sustainability manager may spend more time chasing data than improving performance. An ESG software provider may have a strong platform, but still depend on customers to upload incomplete monthly files. An environmental consultant may need extra time to clean and confirm data before analysis.
Automated ESG data collection reduces this burden. IoT gateways can read meters and equipment at defined intervals, attach timestamps, identify the device, and send the data to the cloud. Teams can still review and validate data, but they start with a stronger base.
Better ESG reporting begins with better measurement. IoT does not replace carbon accounting methods, but it can provide the measured data those methods depend on.
MRV depends on measured, traceable and consistent data
MRV stands for Measurement, Reporting and Verification. In sustainability and carbon workflows, MRV describes the process of measuring activity or emissions-related data, reporting it in a structured way, and making it possible to review or verify the record.
Industrial IoT supports the measurement part by collecting data directly from assets. It supports reporting by moving that data into digital platforms. It supports review by maintaining timestamps, device information and data history.
For carbon MRV IoT workflows, useful features include:
Timestamped readings
Device-level identity
Site-level mapping
Data logs and audit trails
Offline buffering during network outages
Automated data transfer to cloud systems
Alerts for missing or abnormal data
Consistent reading intervals
Traceability from dashboard value back to source device
This matters because ESG and carbon reports often need clear evidence. If a platform shows electricity use for a site, users may need to know where the figure came from, which meter measured it, when it was captured and whether any data was estimated.
OliveIoT does not certify carbon credits or verify carbon offsets. That is a separate role for qualified bodies and approved verification processes. OliveIoT provides reliable measurement data that can support ESG, carbon accounting and sustainability workflows.
That distinction is important. Good measurement does not replace governance, methodology or verification. It gives those processes a stronger data foundation.

Multi-site monitoring gives a single view across operations
Many businesses do not report for one building or one factory. They report across a portfolio. That may include plants, warehouses, offices, utilities, logistics hubs and renewable assets in different regions.
Multi-site sustainability monitoring is difficult when every location follows a different process. One site may submit readings weekly. Another may send monthly bills. A third may share photos by email. A fourth may have a local automation system that no one outside the plant can access.
Industrial IoT can create a shared data structure across sites.
Each site can have gateways connected to local meters and equipment. The gateways send data to the cloud through the available network. A central ESG platform can then receive site-level and asset-level data in a consistent format.
This helps teams compare:
Electricity use per site
Diesel generator runtime across locations
Solar generation across plants
Water use by facility
Gas consumption by process
Energy intensity against production volume
Abnormal consumption patterns
Missing or delayed data
For UK climate-tech companies and ESG software providers, this creates an opportunity to serve customers with industrial operations more effectively. The software can present portfolio-level dashboards, carbon calculations and reporting workflows, while the IoT layer feeds measured data from each site.
OliveIoT as the physical-to-digital layer for ESG platforms
OliveIoT helps connect industrial assets to digital systems. For ESG and carbon accounting platforms, this means less dependence on manual data input and more direct access to measured site data.
OliveIoT can connect existing:
Energy meters
Water meters
Gas meters
Diesel generator controllers
Solar inverters and meters
PLCs
HVAC systems
Industrial equipment
Environmental sensors
The connection can use field interfaces and protocols such as RS485, Modbus, BACnet and 4-20mA, depending on site requirements and the equipment already installed.
Once data is collected, OliveIoT can send it to cloud platforms through:
MQTT
HTTPS
REST APIs
This makes OliveIoT suitable for ESG platform integration, carbon accounting IoT projects, industrial energy monitoring and climate tech IoT partnerships.
The aim is practical. OliveIoT helps software platforms and industrial companies access reliable operational data without expecting sustainability teams to become automation engineers or facility teams to manually compile every reading.
What an IoT-enabled ESG data system can look like
A practical system does not need to be overcomplicated. It needs the right data, collected at the right interval, from the right points.
A typical setup may include:
Layer | What it does | Example sources |
Field devices | Measure real-world activity | Energy meters, water meters, gas meters, solar inverters, DG controllers |
Industrial signals and protocols | Carry readings from assets | RS485, Modbus, BACnet, 4-20mA |
IoT Gateway | Reads, filters and sends data | Site gateway installed in panel or utility area |
Connectivity | Links site to cloud | 4G, Ethernet, Wi-Fi |
Data transfer | Sends data to software | MQTT, HTTPS, REST API |
Cloud platform | Stores and processes information | ESG platform, carbon accounting platform, energy dashboard |
Reporting workflow | Uses measured data | Scope 1, Scope 2, water, energy, solar and sustainability reports |
This design can work for a single facility or for many sites. It can also grow over time. A business may start with electricity and diesel data, then add water, solar, HVAC and production context later.
The best results usually come from clear planning. Before connecting devices, teams should define:
Which ESG metrics need measured data
Which sites and assets are in scope
Which meters already exist
Which data points are available from PLCs or controllers
How often data should be collected
Which cloud platform will receive the data
Which API or data format is required
How missing data and offline periods should be handled
This keeps the IoT system focused on reporting needs rather than collecting data with no clear use.
Partnership opportunities for climate-tech and ESG software companies
Many climate-tech companies and ESG software providers build strong digital tools. They manage emissions factors, reporting frameworks, dashboards, user workflows, reduction planning and customer records. But when customers ask, “Can you collect data directly from our plant equipment?”, the software company may need a trusted industrial IoT partner.
That is where OliveIoT can support a partnership model.
The climate-tech or ESG software company can provide:
Carbon accounting software
ESG dashboards
Reporting workflows
Customer portals
Emissions calculation logic
Scope 1 and Scope 2 reporting modules
Sustainability analytics
Customer success and consulting
OliveIoT can provide:
Industrial IoT gateways
Hardware selection support
Meter and sensor connectivity
PLC and equipment data acquisition
Field protocol integration
4G, Ethernet and Wi-Fi connectivity
MQTT, HTTPS and REST API data transfer
Offline buffering
Site-level deployment support
Data mapping from assets to the cloud
This model lets each partner focus on what it does best. The ESG platform remains the customer-facing reporting and carbon accounting system. OliveIoT supplies the industrial hardware and data acquisition layer that brings real-world data into that system.
For a carbon accounting platform, this can help reduce customer onboarding friction. For an energy-management company, it can add deeper equipment-level data to building and plant analytics. For environmental consultants, it can improve the quality and frequency of data used in client sustainability programmes.
The result is a clearer route from physical assets to reporting outcomes.
Why this matters for manufacturers and facility teams
Manufacturers and facility teams often carry the practical burden of ESG reporting. They are asked to provide energy, fuel, water and equipment data while also running day-to-day operations.
Manual collection can become a repeated task with little operational value. By contrast, IoT-based data acquisition can also support facility improvement.
With better data, teams can:
Identify high energy loads
Track generator usage
Compare solar generation against site demand
Detect water overuse
Understand HVAC energy behaviour
Monitor equipment runtime
Find unusual consumption patterns
Support maintenance planning
Provide sustainability teams with regular digital records
This helps connect ESG reporting with operational improvement. Instead of treating sustainability data as a reporting exercise only, businesses can use the same data to manage energy, water and asset performance.
Key features that make IoT data useful for ESG
Not all data feeds are equal. ESG and carbon workflows need data that is clear, complete and easy to trace.
The most useful IoT data systems include the following features.
Timestamped data
Every reading should include the time it was captured. This helps align energy, fuel, water and production data with reporting periods.
Site and asset identity
The platform should know which site, meter and asset produced each reading. This supports portfolio reporting and audit checks.
Offline buffering
Industrial sites can lose connectivity. Offline buffering stores readings locally and sends them later, reducing data gaps.
Data traceability
Teams should be able to trace a reported value back to the source meter, sensor or controller. This builds confidence in the reporting process.
Flexible integration
ESG platforms may use different cloud structures. MQTT, HTTPS and REST APIs give flexibility for different integration needs.
Support for existing equipment
Many sites already have meters and PLCs installed. Connecting existing assets can reduce replacement work and speed up deployment.
IoT supports reporting, but it does not replace carbon accounting expertise
Industrial IoT provides measured data. ESG and carbon accounting platforms apply methods, emissions factors, reporting structures and review processes.
Both roles matter.
An IoT gateway can report how much electricity a site used. The carbon accounting platform decides how that electricity data is mapped, which emissions factor applies, how market-based or location-based reporting is handled where relevant, and how it appears in the final report.
An IoT system can record diesel generator runtime and fuel consumption. The ESG platform can use that activity data for Scope 1 emissions calculations.
An IoT system can capture water flow. The sustainability platform can use it for water reporting and target tracking.
This separation keeps the system clear. OliveIoT does not certify carbon credits or verify carbon offsets. OliveIoT provides the measurement and data acquisition layer that supports reliable ESG, carbon accounting and sustainability workflows.

A practical path to automated ESG data collection
A successful project usually starts with a focused scope. Trying to connect every meter and every machine on day one can slow progress. A better approach is to begin with the data that matters most for reporting and then expand.
A practical path may look like this:
Define the reporting need
Identify which ESG or carbon metrics need measured data. Common starting points include electricity, diesel, gas, water and solar generation.
Map the assets and meters
List the meters, PLCs, controllers and systems available at each site. Check communication options such as RS485, Modbus, BACnet or analogue signals.
Choose the data points
Decide which values to collect. For example, kWh, flow, runtime, fuel level, solar generation, water totaliser, load or equipment status.
Install the gateway
Connect the Industrial IoT Gateway to the selected assets. Configure read intervals, device mapping and local data handling.
Set up connectivity
Use 4G, Ethernet or Wi-Fi based on site conditions. Add offline buffering where connectivity may be inconsistent.
Connect to the cloud platform
Send data through MQTT, HTTPS or REST APIs to the ESG, carbon accounting or energy-management platform.
Validate and review
Compare readings against known meter values or bills during the early stage. Check timestamps, units, asset mapping and site labels.
Scale across sites
Once the first site proves the model, roll out the same structure across more locations with consistent naming and data rules.
This keeps the project practical and measurable. It also gives ESG software providers a repeatable deployment model for industrial customers.
Why UK climate-tech and ESG platforms should consider the hardware layer early
For UK climate-tech companies serving manufacturers, property groups, utilities, logistics operations and industrial customers, the data collection layer can affect the success of the whole platform.
If the software depends only on manual uploads, customers may struggle to keep data current. If the system accepts measured data from site equipment, customers can reduce the reporting workload and gain more frequent visibility.
This is especially relevant for businesses working toward net-zero goals, internal carbon budgets, energy-cost control, supplier reporting or investor-led ESG disclosures.
The hardware layer should not be an afterthought. It affects:
Data quality
Customer onboarding
Reporting frequency
Audit readiness
Site coverage
Integration effort
Long-term customer value
By partnering with OliveIoT, ESG and carbon software companies can add industrial data acquisition capabilities without building hardware, field connectivity and protocol expertise from scratch.
Build ESG reporting on measured data
ESG reporting, carbon accounting and sustainability programmes need a dependable link to physical operations. Industrial IoT provides that link by collecting electricity, fuel, gas, water, solar and environmental data directly from meters, sensors, PLCs and equipment.
For software companies, it creates a stronger data foundation for digital platforms. For manufacturers and facility teams, it reduces manual work and improves visibility. For sustainability and energy-management teams, it supports better Scope 1, Scope 2 and resource reporting with timestamped, traceable records.
OliveIoT can act as the physical-to-digital data layer for ESG platforms, connecting existing industrial assets to the cloud through MQTT, HTTPS and REST APIs.
To discuss ESG data acquisition, carbon monitoring IoT, industrial sustainability monitoring or ESG platform integration, contact OliveIoT for Industrial IoT and ESG data integration support.


Comments